Expected Value on Prediction Markets: Position Size and Trade Math
Expected value on prediction markets explained: how it is calculated, what fees and spread take out, why one trade proves nothing and how size shapes drawdowns.

Expected value is what a trade is worth on average if you could repeat it many times. On a prediction market it equals your probability estimate multiplied by the $1 payout, minus the price you pay. It is positive only when your estimate beats the price, and even then any single trade can lose.
What expected value means on a prediction market
Every share pays $1 if its outcome happens and nothing if it does not. That makes the arithmetic simple. If you believe an outcome has a certain chance, a share is worth that chance times $1. The price is what the market asks for it.
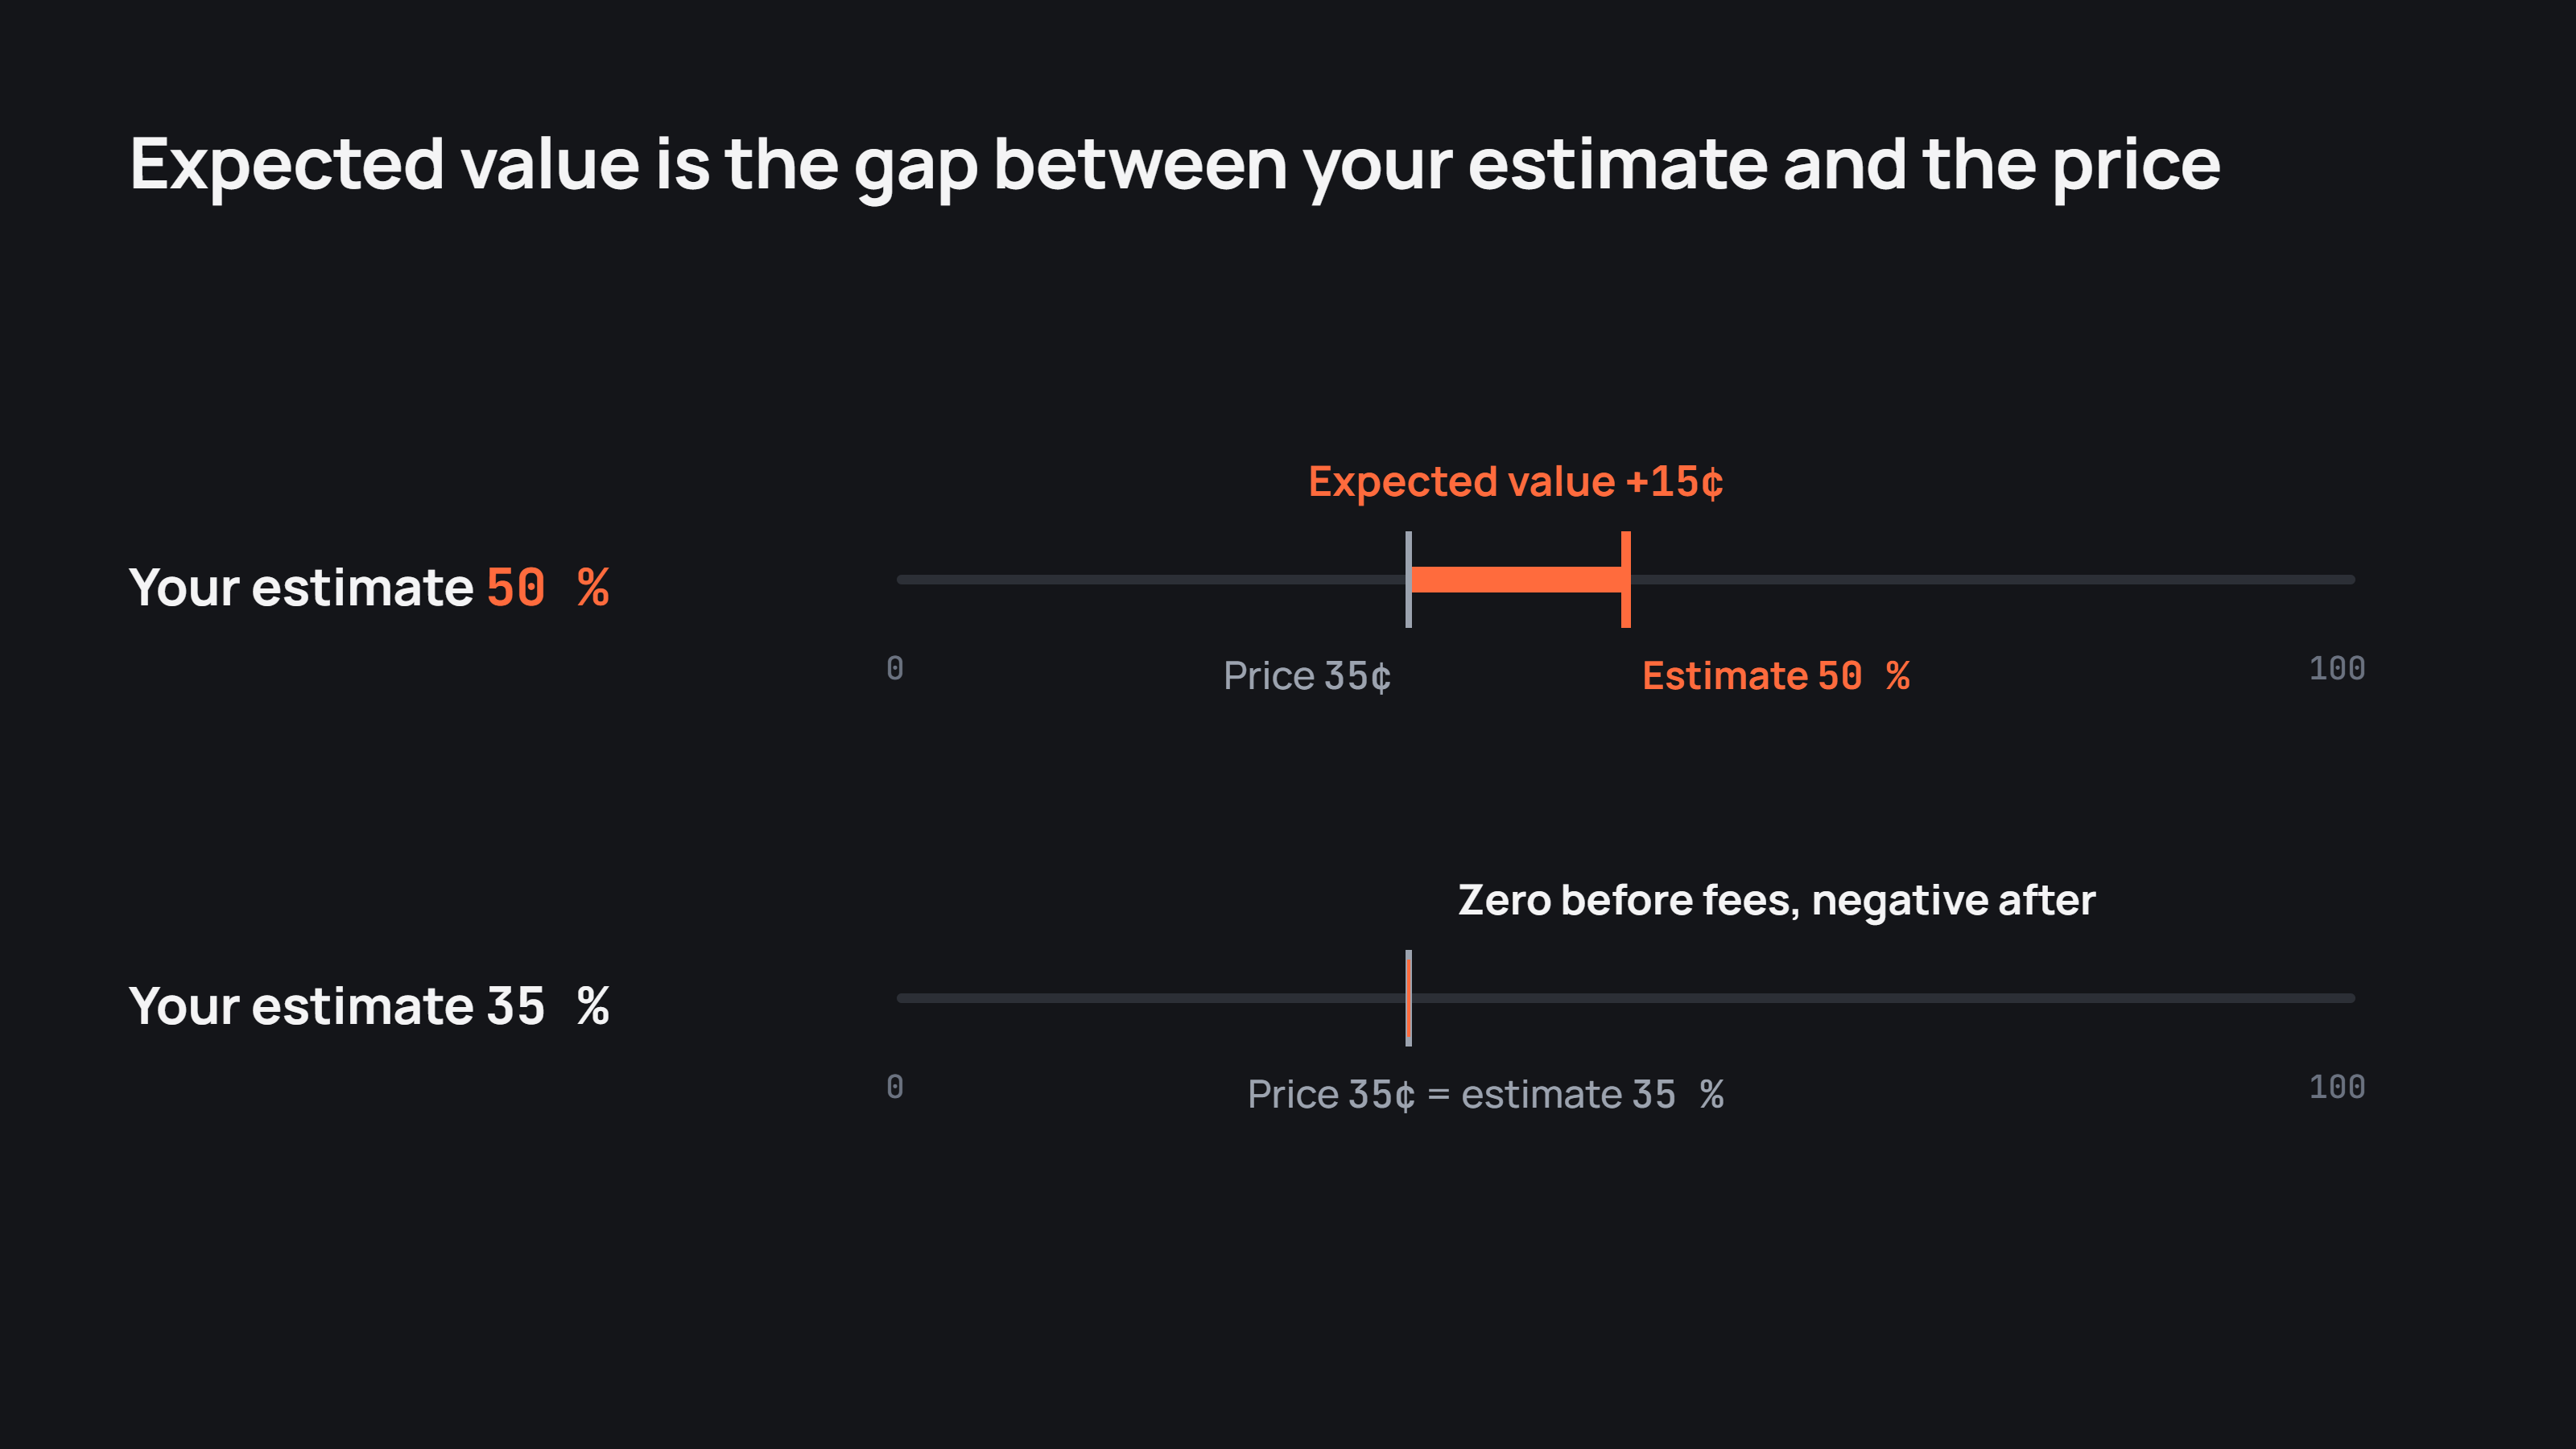
Say you estimate an outcome at 50 %, and its share trades at 35¢. On average the share is worth 0.5 × $1 = 50¢ to you, and you pay 35¢. The expected value is 15¢ per share, before fees. If your estimate were 35 % instead, the share would be worth exactly what you pay for it, and the expected value would be zero.
Expected value is an average, not a forecast of one result. The same trade pays 65¢ when it wins and loses 35¢ when it does not. The 15¢ appears only across many trades like it.
Your estimate is the weak link
The price is a number you can read. Your estimate is a number you have to produce, and the whole calculation depends on it.
An estimate that is too optimistic turns a zero-value trade into one that looks attractive. Because the market price already reflects what other traders expect, a gap between your number and the price means either you know something the market has not priced in, or your number is off. How a price works as the market's own probability estimate is covered in price as probability.
This is why expected value is a way of checking a trade rather than a way of finding one. It tells you what your estimate implies, not whether your estimate is right.
What fees and spread take out
Expected value before costs is only a starting point. Two costs come off it on every trade.
The spread is the first. A market order buys at the best ask, which sits above the midpoint shown on screen, so you pay a little more than the price you read. Selling before settlement costs the spread again.
The taker fee is the second. On Polymarket it depends on the category and peaks when a share trades near 50¢, where the gap between estimate and price is often smallest. A few cents per share can take a large part of a thin edge. The full fee table is in Polymarket fees.
Holding to settlement pays these costs once. Trading in and out pays them each time. A small expected value survives the first pattern more easily than the second.
Why one trade says nothing
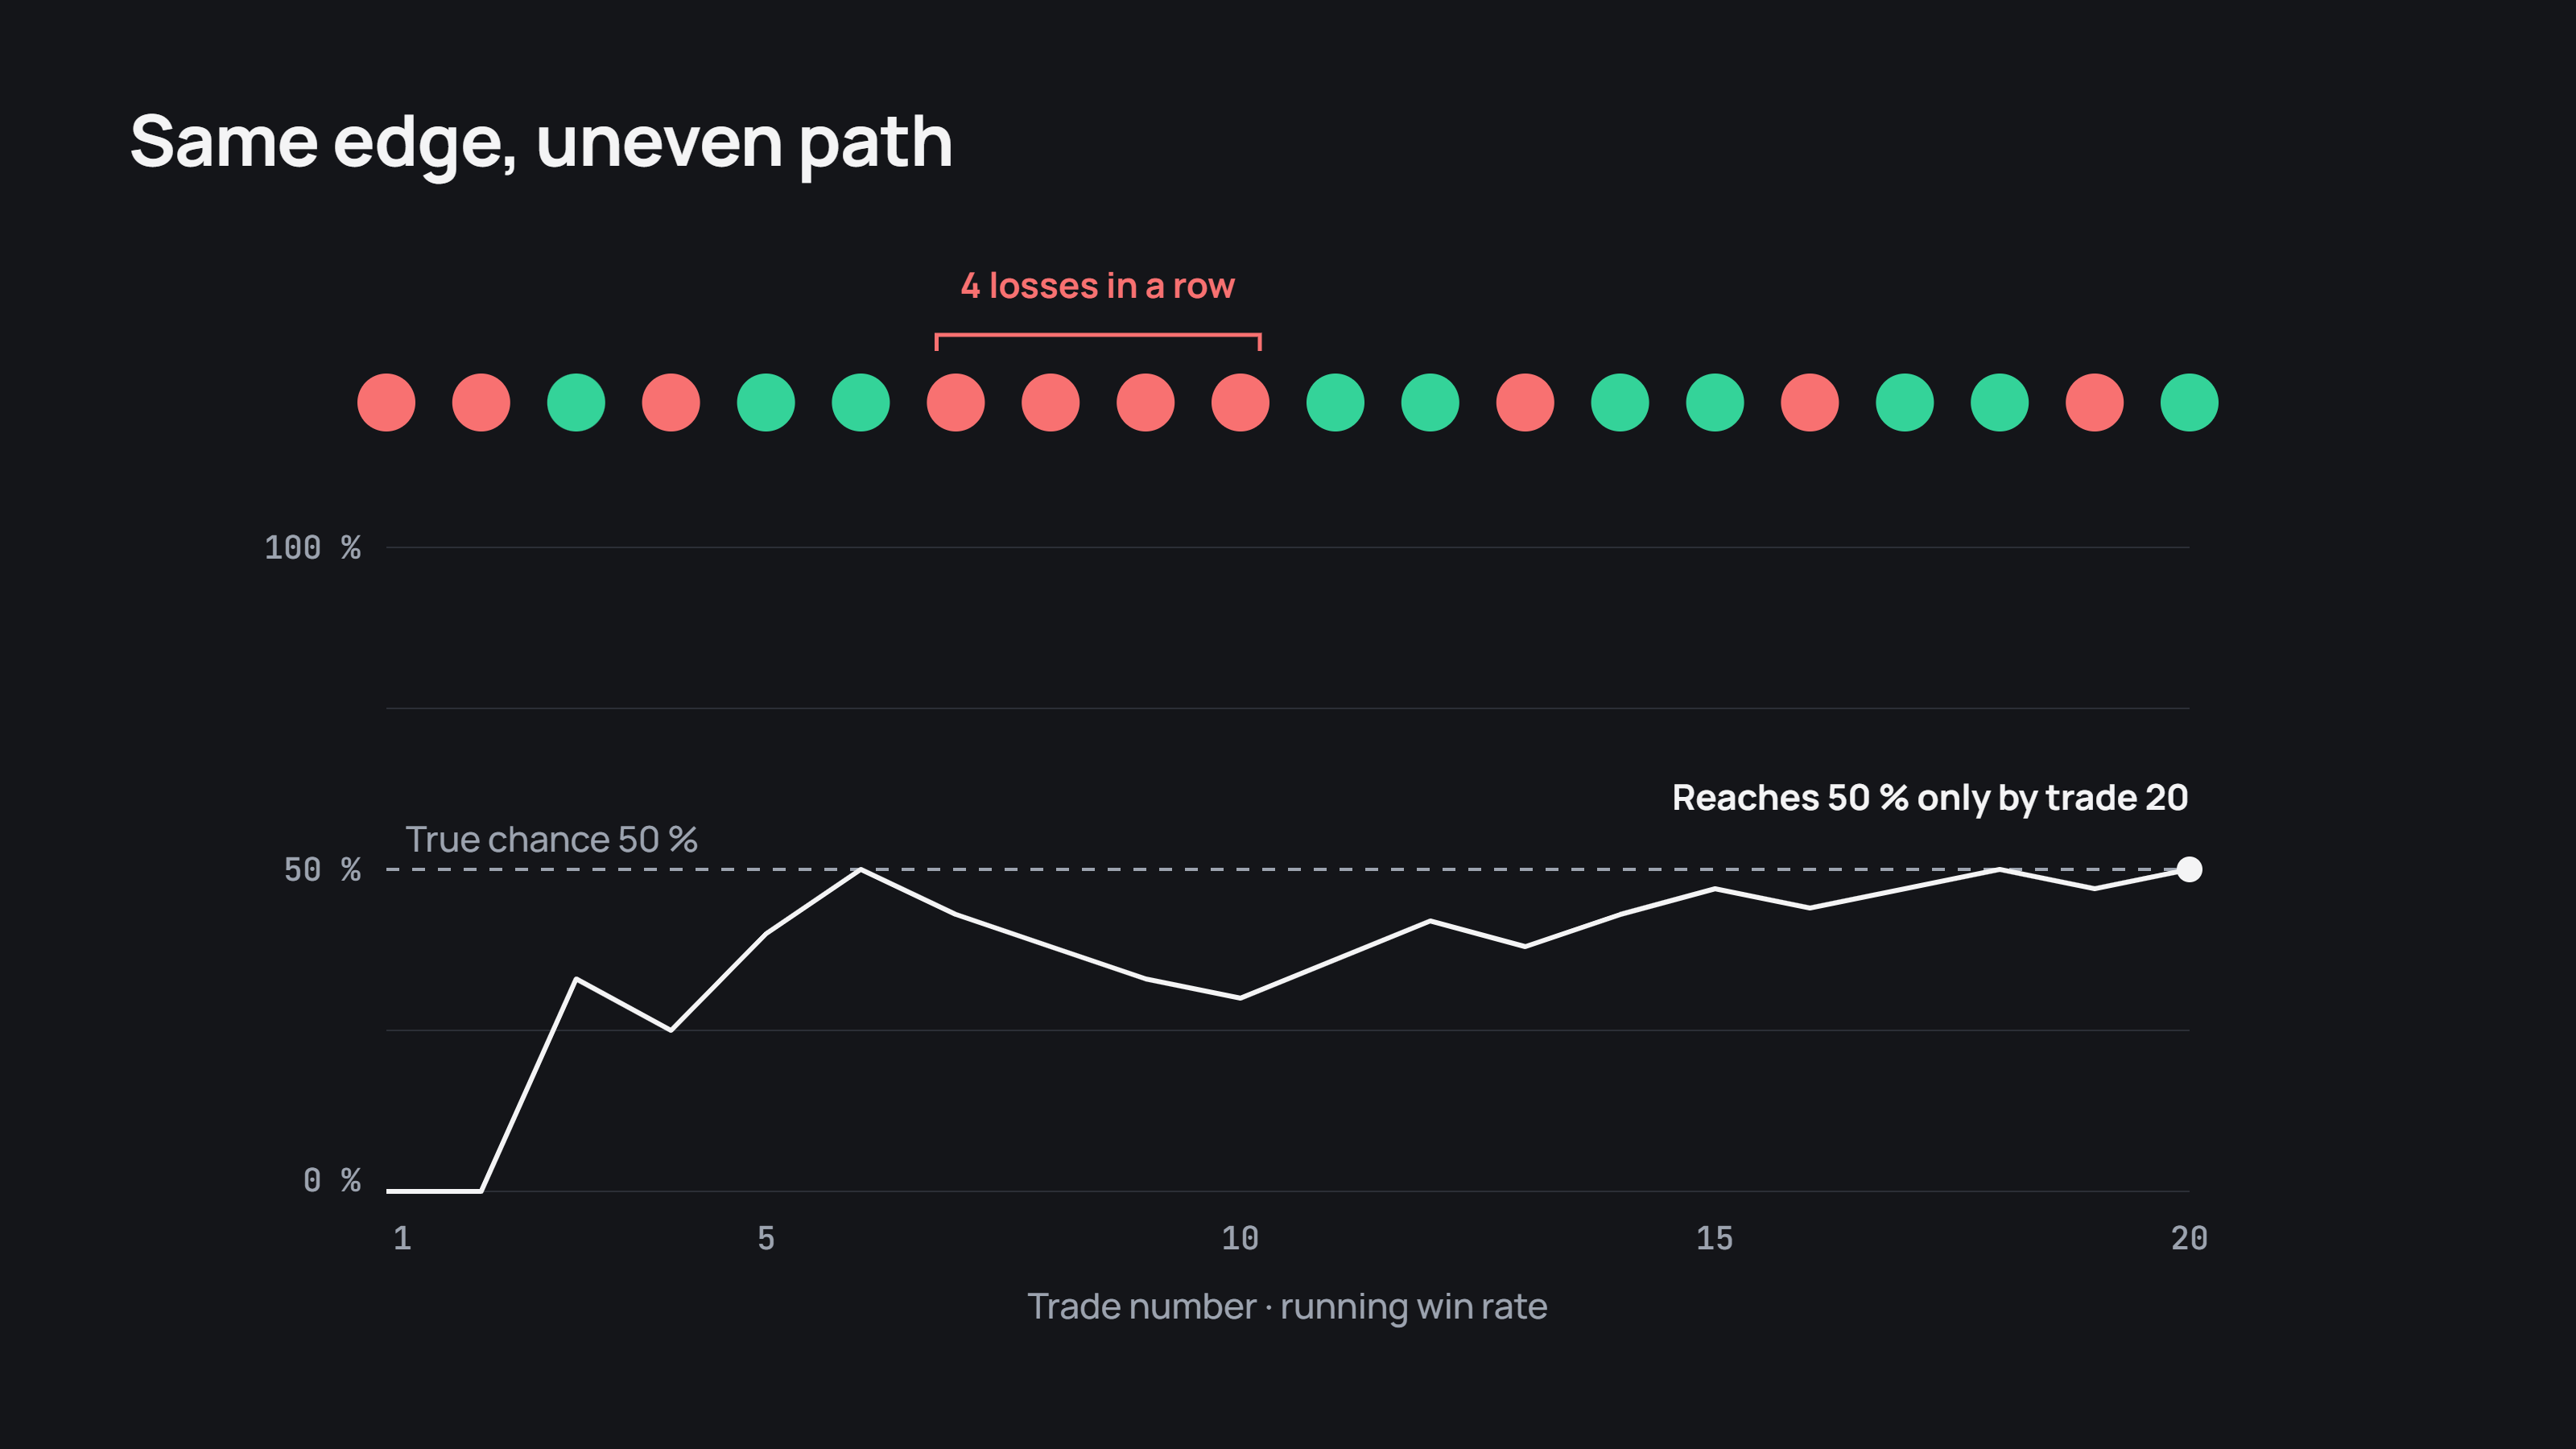
A single result cannot confirm or refute an estimate. An outcome you rate at 50 % will fail half the time even when your estimate is exactly right.
Over a series of trades the results come unevenly. Runs of four or five losses in a row are ordinary across a few dozen trades with a 50 % chance each. Runs of wins look like skill for the same reason. Judging an estimate by the last trade, or even the last five, mostly measures luck.
The useful unit is a batch of settled trades in similar conditions. Several dozen start to show whether your wins arrive as often as your estimates said they would.
Size and drawdown
Expected value is counted per share. Size decides how that average feels on the way.
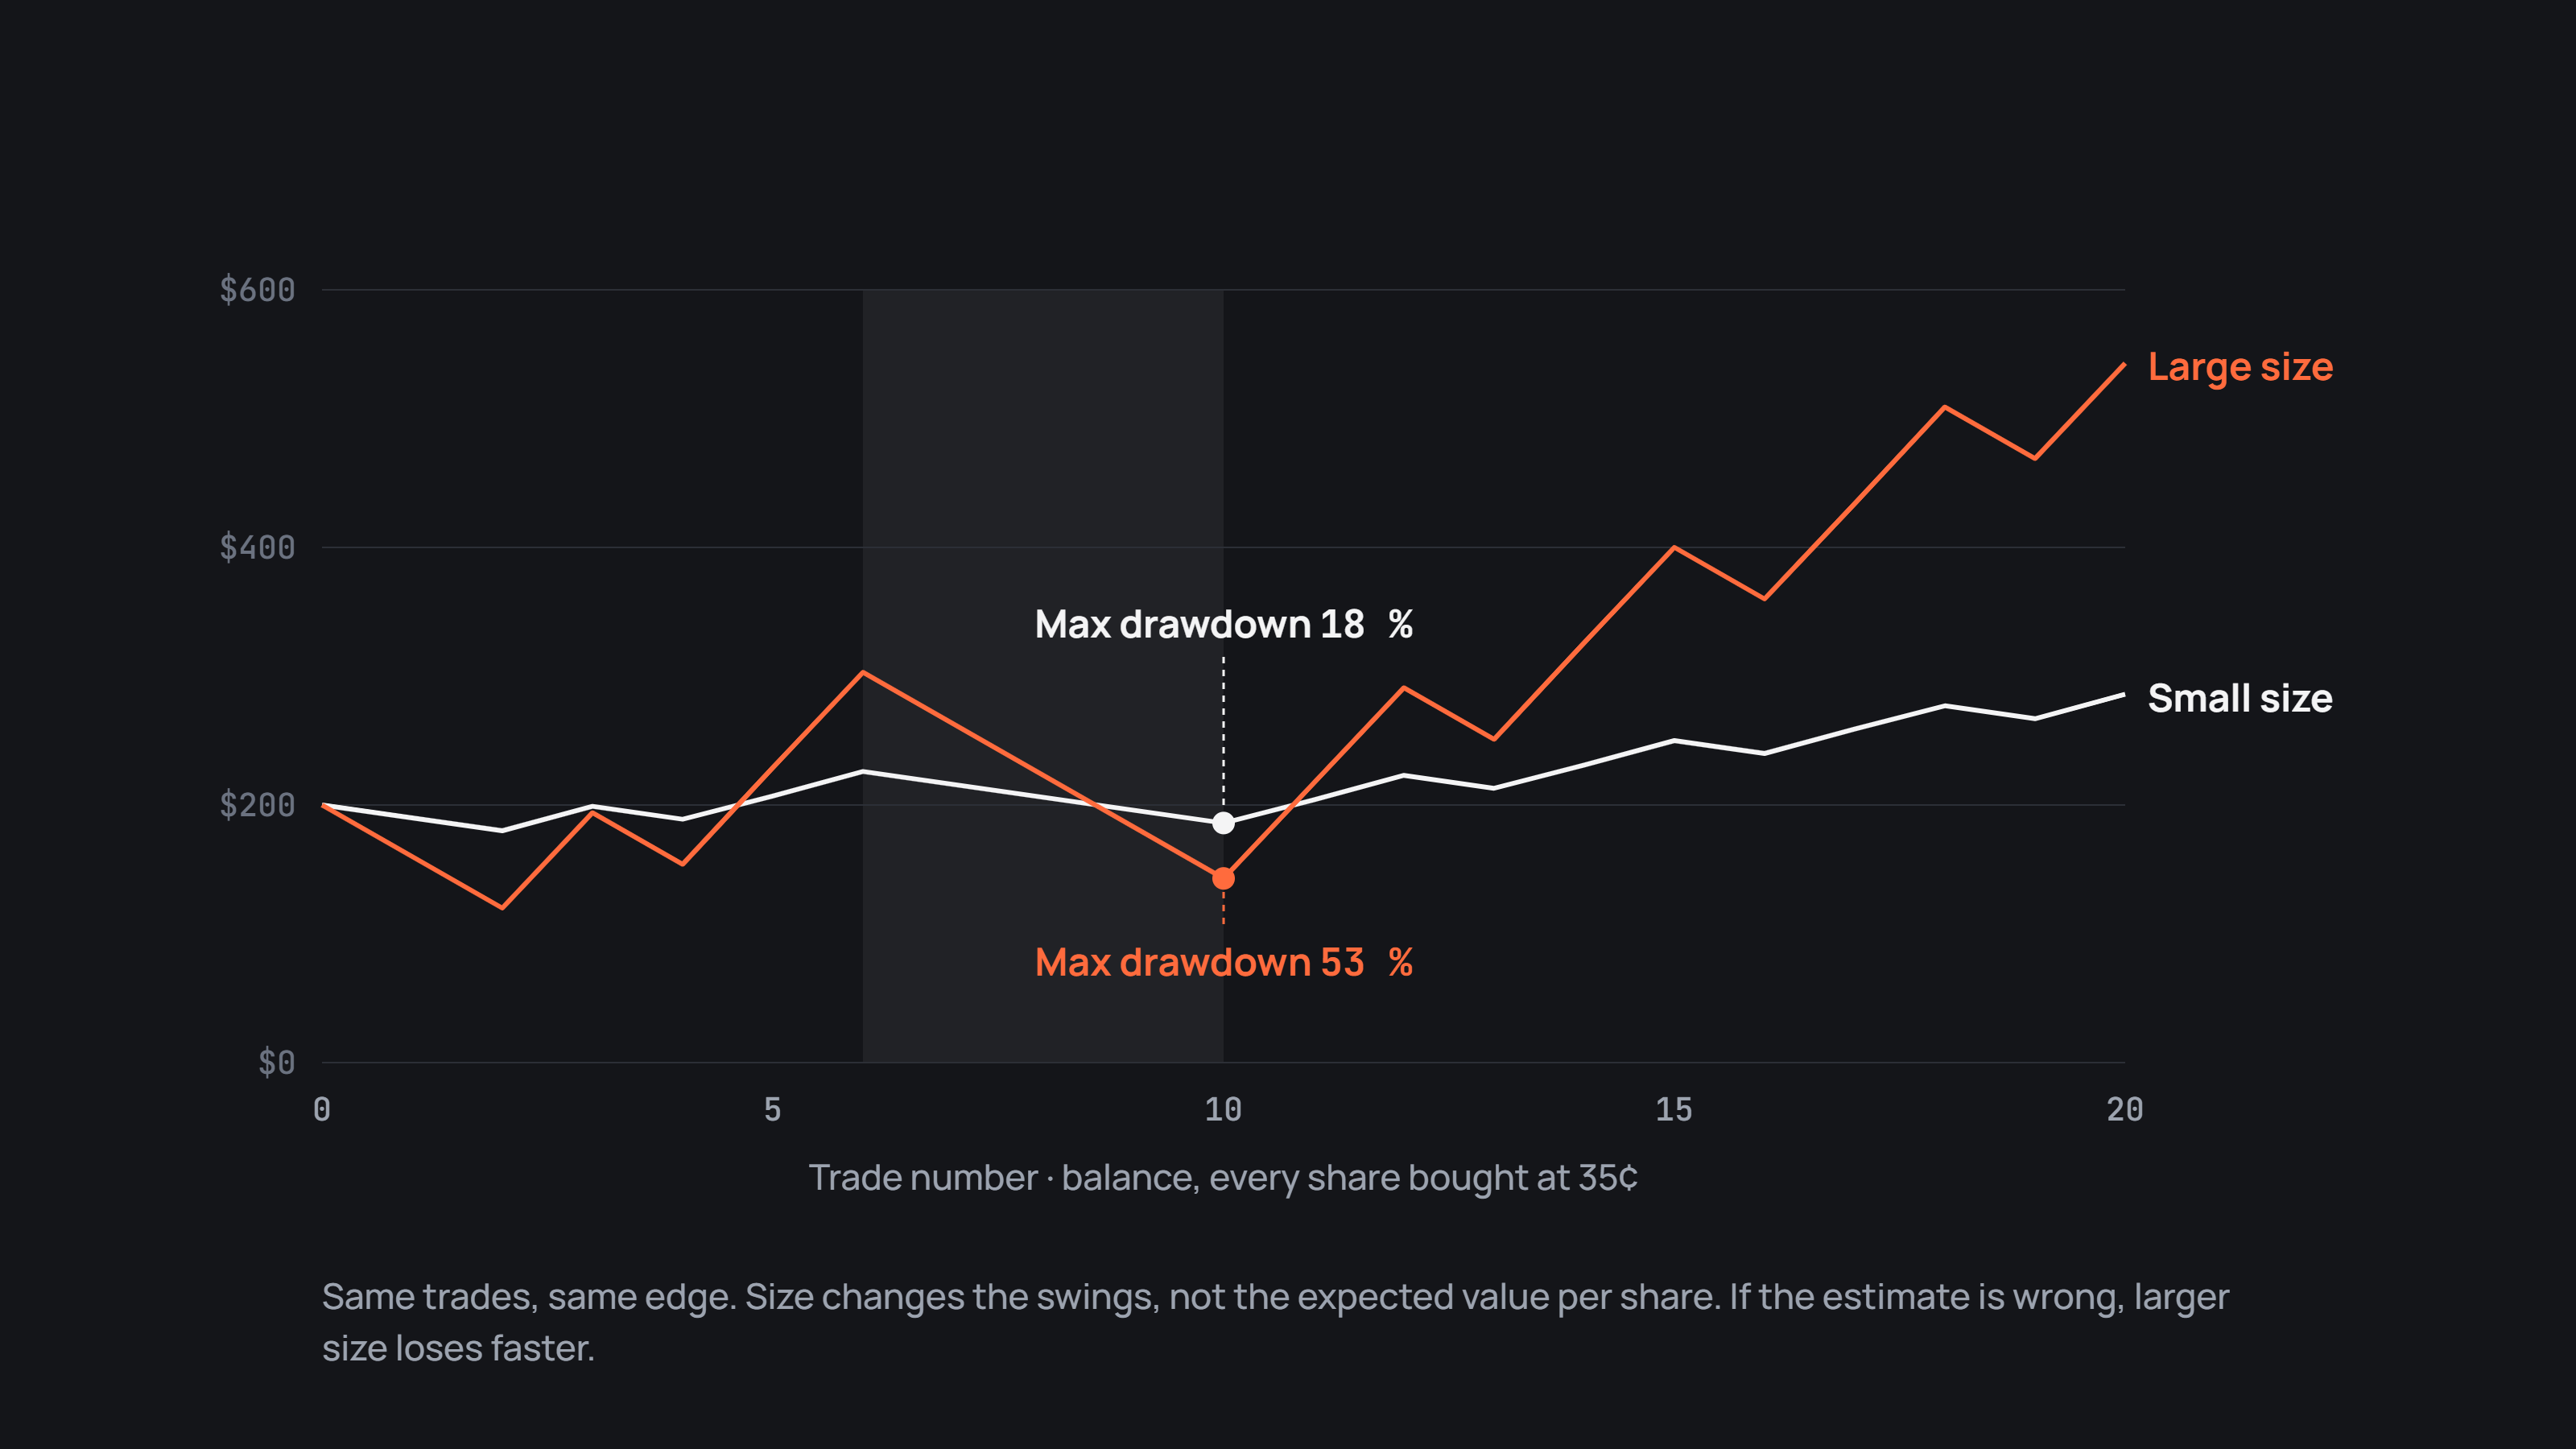
Take one series of twenty trades, each bought at 35¢ with a true chance of 50 %, half of them winning, including a run of four losses. Play that series once with a small share of the balance on each trade and once with a large one. Both end in the same direction, because the edge is the same. The paths differ. With the larger size the balance falls much further during the losing run before the wins arrive.
A deeper fall also needs a larger climb back. Losing half a balance takes doubling what is left to recover. If the estimate behind the trades was wrong, a larger size reaches that fall faster. It also leaves less to recover with.
How much to put into a trade is your decision. The arithmetic only shows that size does not change the expected value per share. It changes the depth of the swings you sit through while that value shows up.
Long shots and favourites
Two trades can have the same expected value and very different paths.
A long shot bought at 10¢ loses most of the time and pays nine times its price when it wins. A favourite bought at 90¢ wins most of the time and gives back a large stake on the rare loss. Both can carry the same edge per share. The long shot's results arrive as long dry spells broken by rare large wins. The favourite's arrive as steady small gains broken by rare large losses.
Neither is safer by nature. They suit different tolerances for how results arrive. Liquidity and time to settlement also differ by category, and those differences are covered in where the edge is by category.
Expected value over time
Expected value per share says nothing about how long the money is tied up. A 15¢ edge in a market that settles tomorrow and the same edge in a market that settles in six months are the same number on paper. In practice the first frees the money for the next trade, while the second holds it for half a year.
That is why traders often compare edges per month rather than per trade. The calculation is the same, divided by the time to settlement. It favours short markets when edges are similar, and it makes long markets worth entering only when the gap is large.
Four common mistakes in counting expected value
Counting from the midpoint. The price on screen is the middle of the book. A buy fills at the ask, so the real entry price is higher.
Leaving out fees. Near 50¢ the taker fee is at its highest, and a thin edge can disappear into it.
Treating related positions as separate. Two markets on the same election, or on the same coin, tend to win and lose together. Their expected values add up, and so do their losing runs.
Judging too early. A dozen settled trades cannot confirm an estimate either way.
Checking your estimates against your own history
The honest test of expected value is the record of what happened. If your estimates are good, outcomes you bought around 30¢ while rating them at 45 % should win close to 45 % of the time over enough trades.
Pulse Analytics shows this in the Price vs. win block, which compares your entry prices with your actual win rate. Results by category show where the gap holds and where it does not. Neither says how much to trade. Both show whether the estimates behind your trades earn their keep.


