Cryptoindex.ai Review: Reading Crypto Market Structure Before You Price an Event
A prediction trader's review of Cryptoindex.ai: bitcoin dominance with the stablecoin adjustment, the altcoin season index, CI100, and where the structural read fits beside a terminal.

Cryptoindex.ai publishes crypto indices, bitcoin dominance and an altcoin season reading on free pages with no account. For anyone pricing a crypto event contract, it answers one narrow question fast: what kind of market is this right now. This review covers what the site does well, where it stops, and how the reading sits beside a trading terminal.
Every crypto question on a prediction market turns into the same problem. Will bitcoin close above a level by year-end? Will ether outperform bitcoin this quarter? Will altseason arrive before the cycle turns? You are asked to put a number on it, and the market prices your answer in cents.
Most crypto commentary gives you narrative when the work needs structure. On 10 September 2026, total crypto market capitalization fell 4.27% in twenty-four hours while bitcoin dominance rose to 58.57%. Together those two readings say something specific: bitcoin fell less than everything else, capital moved defensively, breadth was deteriorating. If you were pricing an altcoin event that week, that combination mattered more than any thread you read.
What the site is
Three parts sit under one roof, and separating them helps.
Live indices. Nineteen of them, published by Cryptoindex.ai itself, covering the broad market, sector themes and individual chain ecosystems. These are display indices: published series with open formulas, not funds and not products you can buy.
Tracker for third-party benchmarks. The Nasdaq CME Crypto Index, the CoinDesk 20, CCi30, CMC 100, Coinbase 50 and others, shown side by side. Where a public feed exists, the site shows the official print. Where it does not, it shows a transparent market-cap proxy and labels it as a proxy on the page. More on why that matters below.
Structure and sentiment gauges. Bitcoin dominance, the altcoin season index and a fear and greed reading, each on its own page with history.
No account is required to view any of it, which is the right default for a research tool.
The three readings that move crypto event pricing
Bitcoin dominance
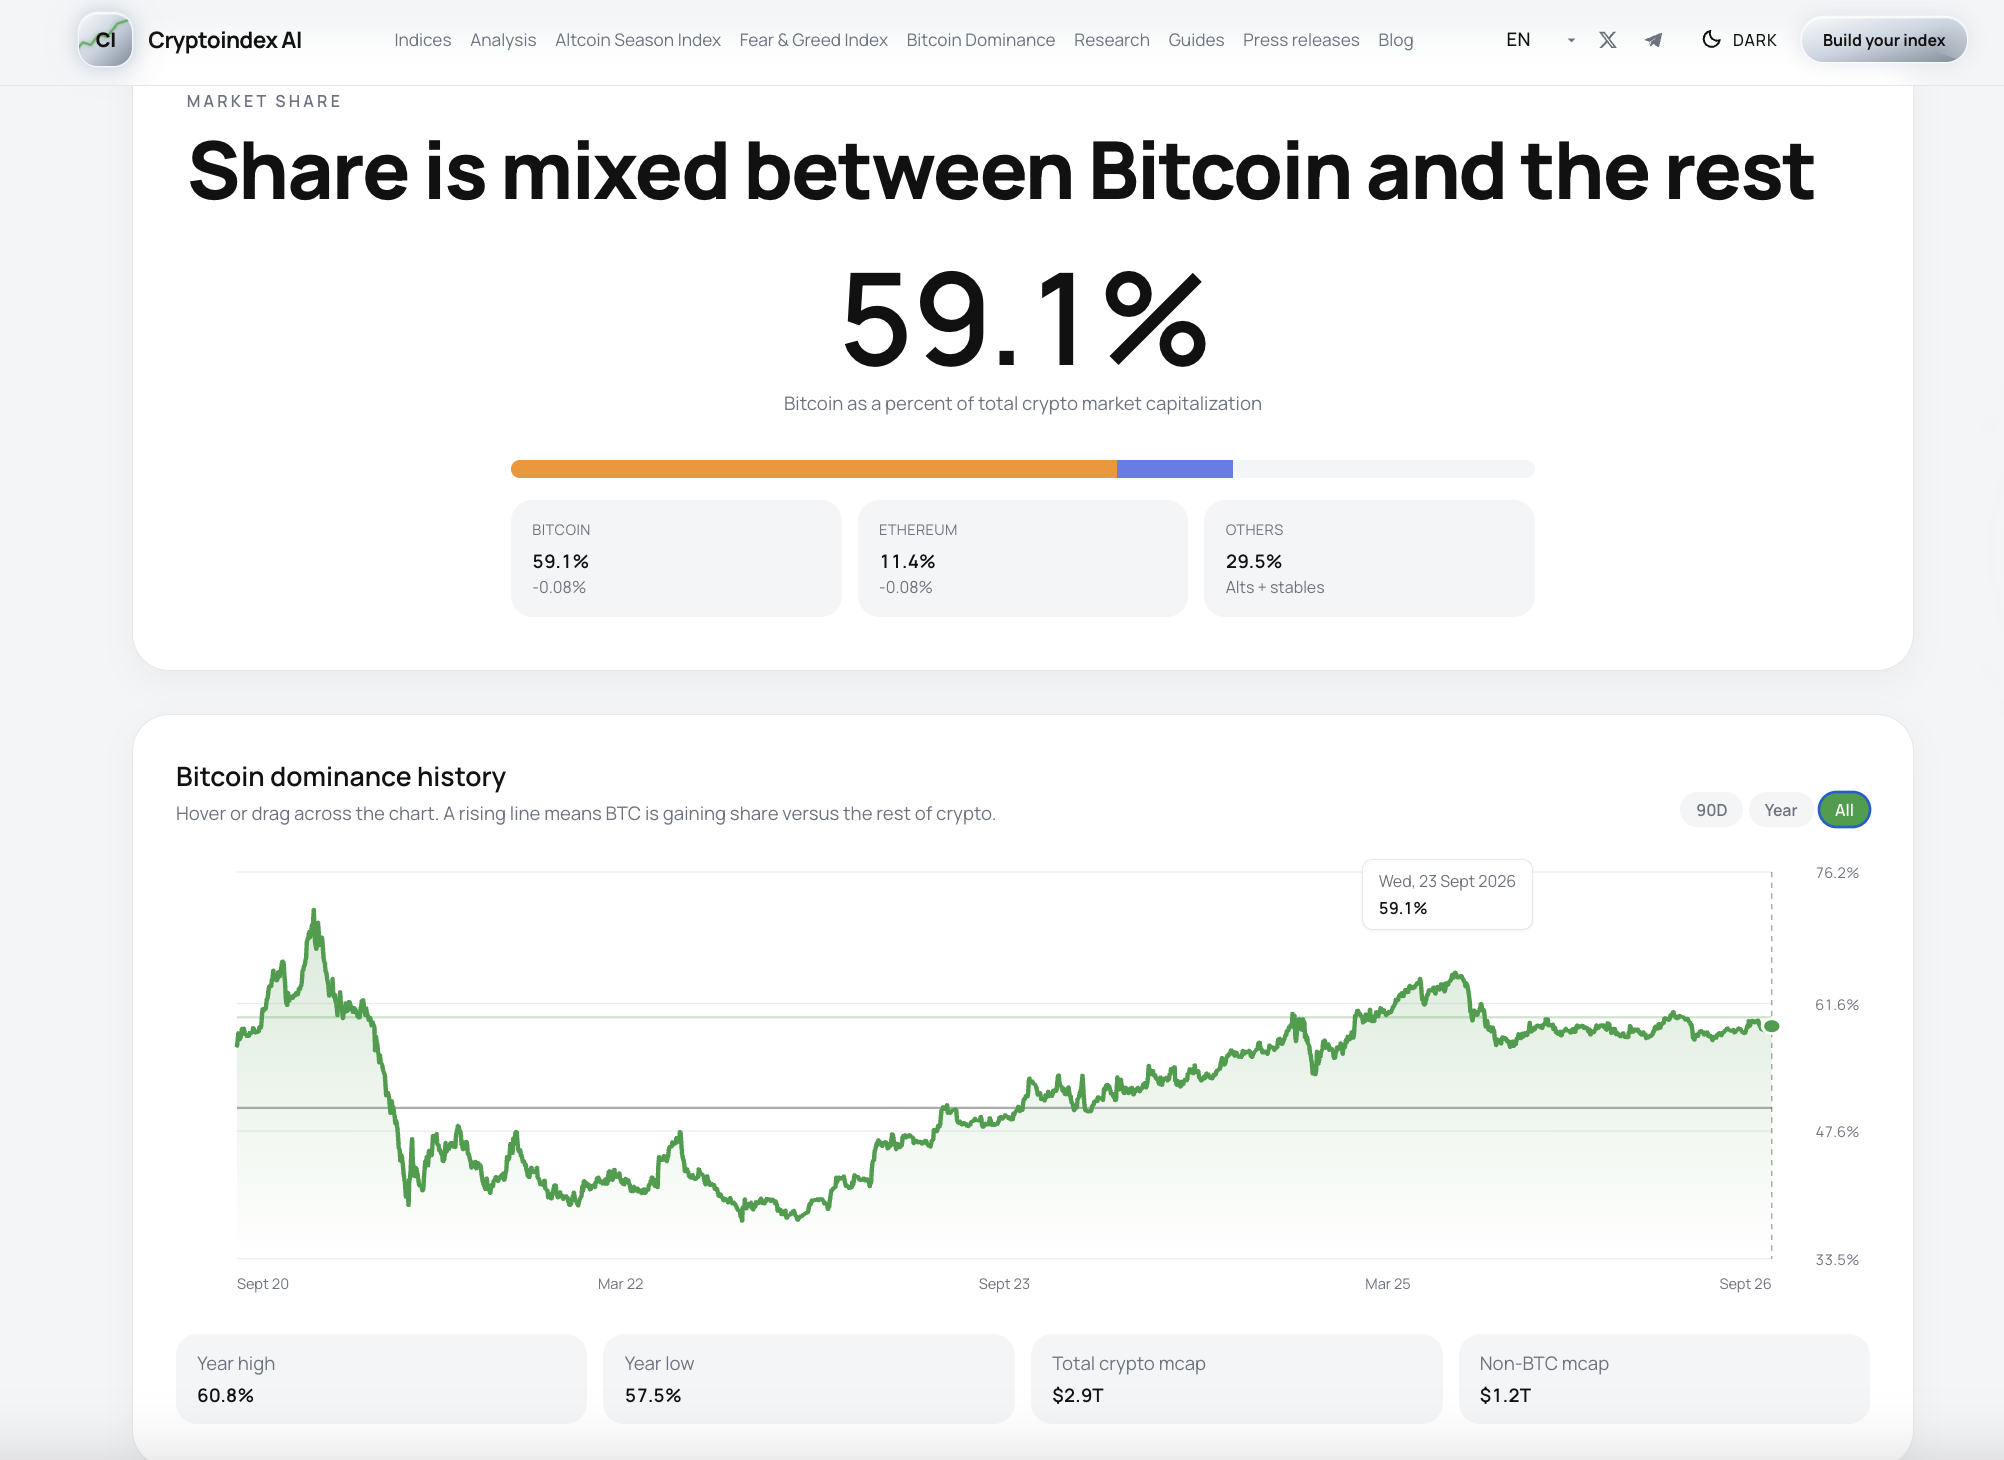
Cryptoindex.ai bitcoin dominance chart, reading 59.1% on 23 September 2026.
Bitcoin's share of total crypto market capitalization. Through 2026 it has run in the high fifties, with a year high of 60.8% and a year low of 57.5%. The site also publishes an ex-stablecoin version, which matters more than it sounds.
Stablecoins are roughly 11% of total market cap, and they are dollars parked on the sidelines rather than risk assets. Leave them in the denominator and dominance falls every time traders de-risk into USDT, which reads as a rotation into altcoins when the opposite is happening. Strip them out and bitcoin's share of the risk-taking market was closer to 65% in early September.
For pricing purposes, the useful discipline is reading dominance next to bitcoin's own price. A ratio moves when either side moves, and the four combinations carry four different meanings. Dominance up with price up is a bitcoin-led rally. Dominance up with price down, as September was, is risk-off. You make the same distinction reading a share price as a probability. The number alone tells you less than the number next to what moved it.
The altcoin season index
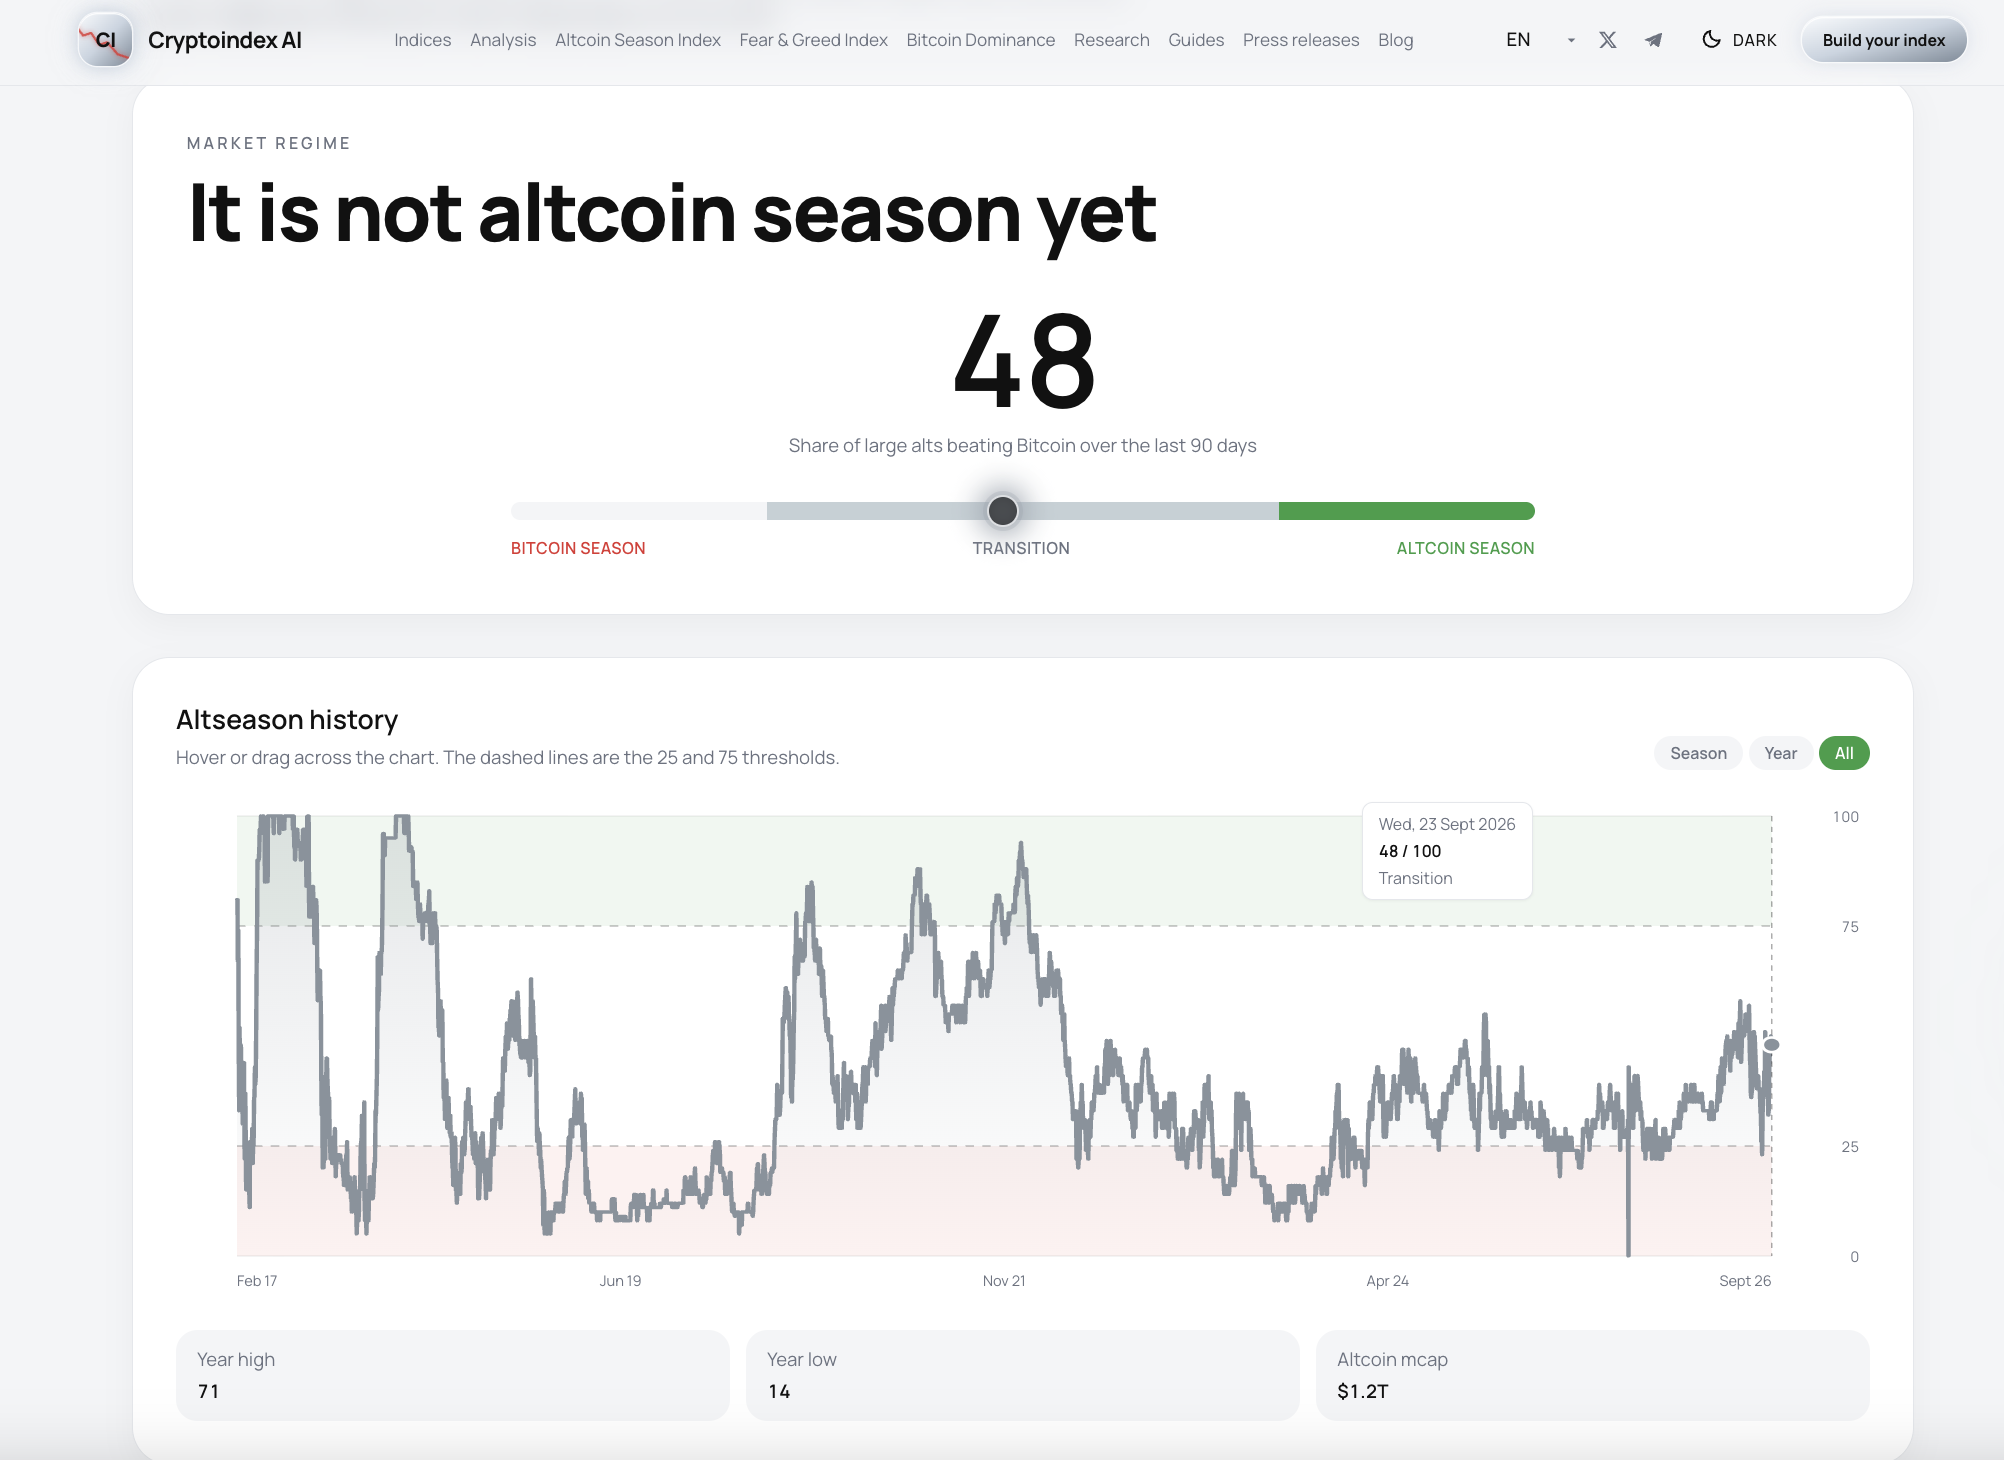
Cryptoindex.ai altcoin season chart, reading 48 out of 100 on 23 September 2026.
This gauge is close to a prediction market in its own construction. It counts how many of the top 50 coins, excluding stablecoins and wrapped tokens, outperformed bitcoin over a rolling 90 days. At 75 or above it is altseason. At 25 or below, bitcoin season.
On 23 September 2026 it read 48, in the transition band between the two thresholds. The year high was 71 and the year low 14, so the range it travels is wide.
Two points are worth knowing before you trade off it. The window is 90 days, which makes the index a confirmation tool rather than a leading one. By the time it crosses 75, the rotation has been running for weeks. And different providers use different universes. The original index uses the top 50, CoinMarketCap's version uses the top 100. The two routinely print ten to fifteen points apart on the same day. If a market you are trading resolves on "altseason", find out which index the resolution source names before you size anything. Wording decides these contracts, which is the same care the crypto category demands market by market.
CI100, the broad benchmark
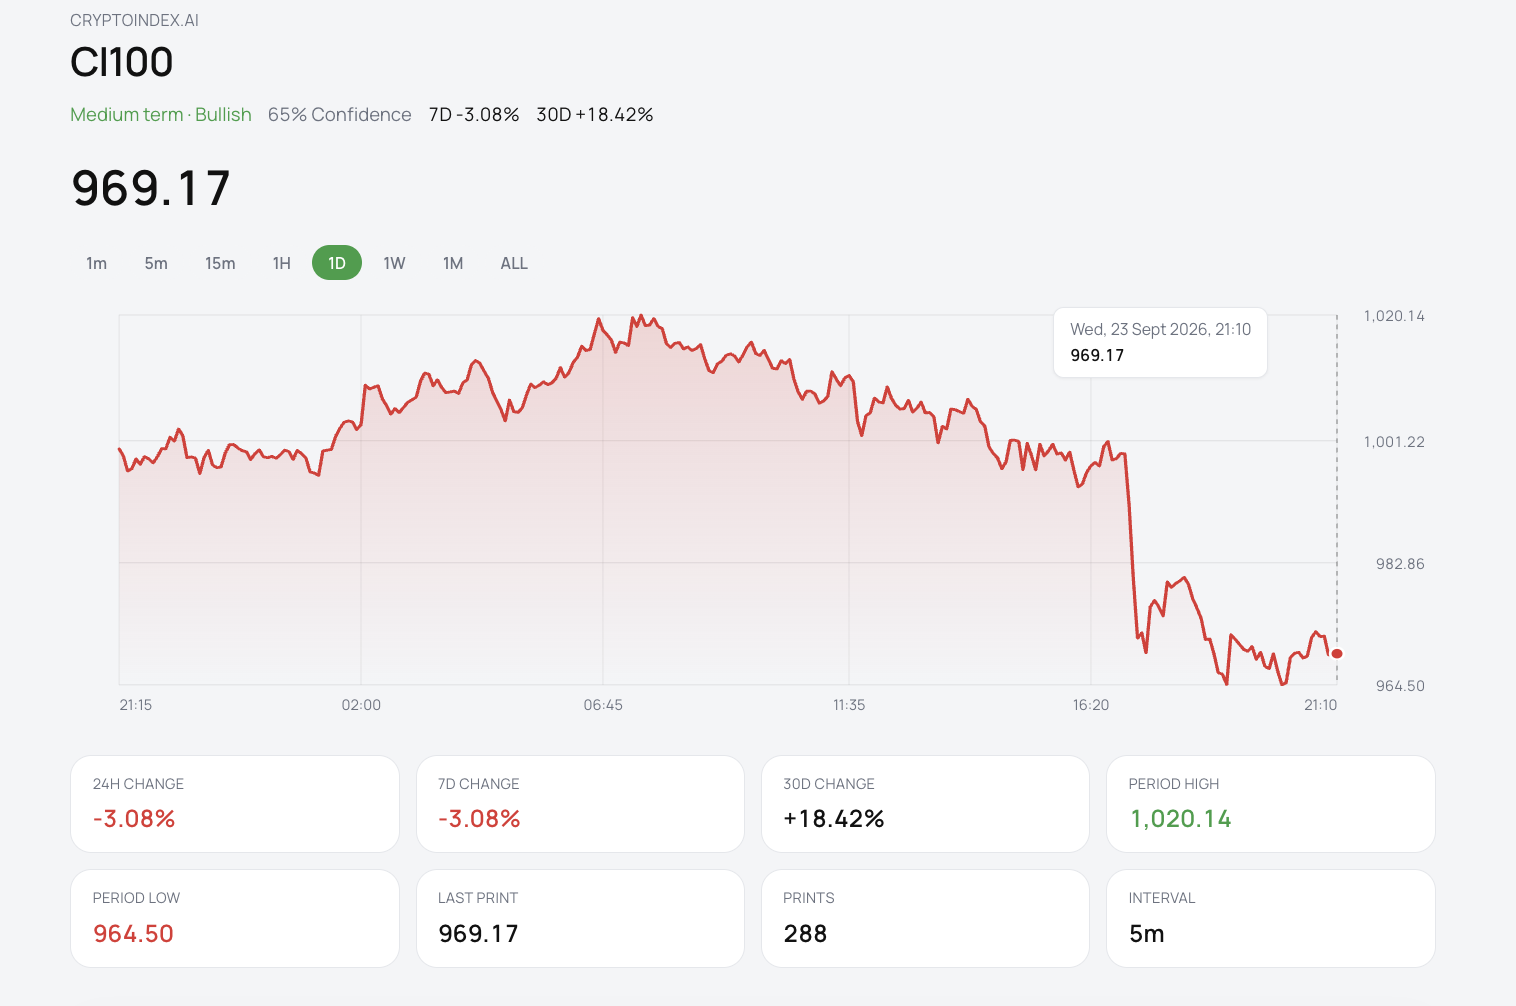
CI100 is the flagship of the Cryptoindex family, printing 969.17 on 23 September 2026.
CI100 tracks the top 100 crypto assets by size, trading volume, liquidity and recent volatility. It recalculates every five minutes and gives the market's overall direction in a single line, without the noise of watching fifty tickers.
Around it sits a family of about twenty more. CI-Alts drops bitcoin entirely, so you can see what the rest of the market is doing on its own. There are indices for the top 10, 15, 25 and 50, for sectors such as AI, DePIN, DeFi and real-world assets, and for chain ecosystems including Solana and Base. All are free to view, and each publishes its formula.
The practical habit is short. Check CI100 for direction, then open whichever narrower index matches the event you are pricing. If the question is about altcoins, CI-Alts tells you more than a bitcoin chart will.
How the indices are built
Most free index trackers weight by market capitalization and stop there. The Cryptoindex flagship does something different, and it changes what the number tells you.
CI100 blends four factors:
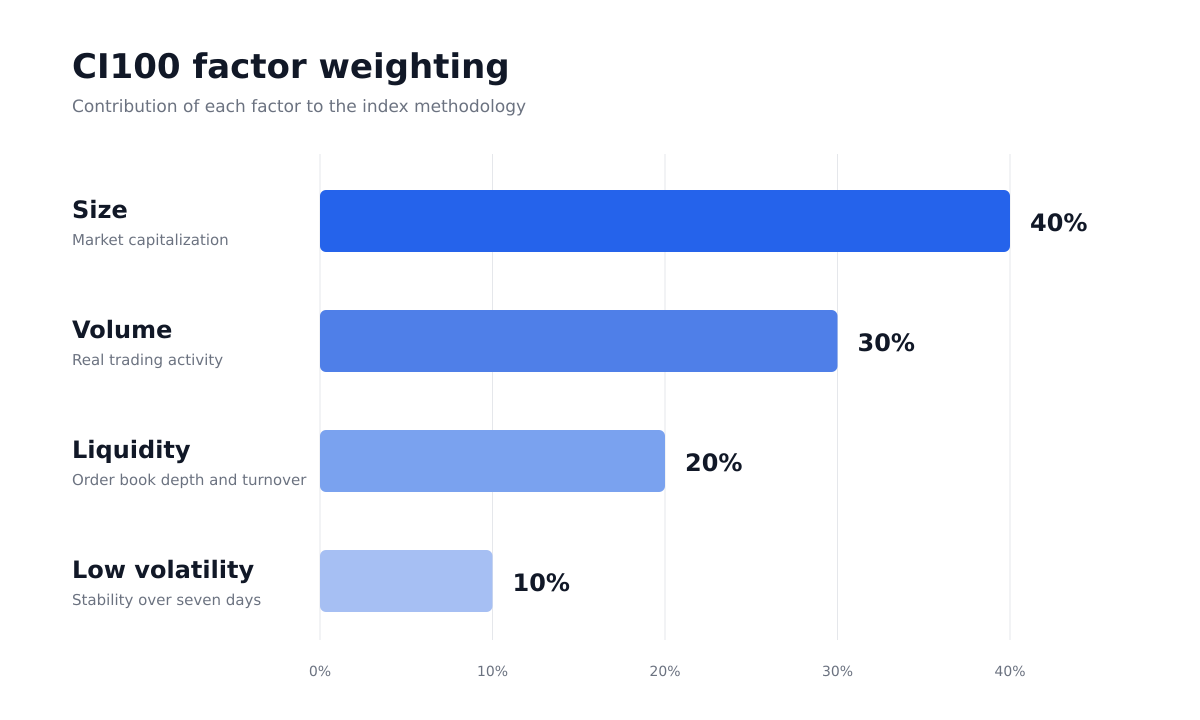
Size at 40% keeps the index anchored to the market's shape. Volume at 30% and liquidity at 20% together carry half the weight, which is the deliberate part: a token has to trade, not merely exist, to earn a place. Anyone who has watched a thin-book asset post a large nominal market cap will recognise the problem that solves. The same four factors pick the hundred constituents, so one view of quality runs through selection and weighting alike.
The full formula sits on the methodology page, and the index recalculates every five minutes from live exchange prices with a base of 1,000.
That design carries two honest caveats. Composition and weights refresh continuously rather than locking for a month or a quarter. That produces an unusually current picture, and it means no real portfolio could replicate the index trade for trade. And it is a display index rather than a fund: a measurement instrument, presented as one.
The part prediction traders will find most useful
Broad indices tell you what the market did. Sector and ecosystem indices tell you where the money went, and that is usually the question underneath an event contract.
Ecosystem indices measure a chain's economy rather than its token. CI-Solana tracks the most liquid projects in the Solana ecosystem plus a curated SOL core. CI-Base does the same for Base. When capital rotates into applications on a chain, the ecosystem can run ahead of the base asset, and it works the same way on the way down. If you are pricing anything about a chain's growth, the ecosystem series answers a question the token price cannot.
Sector indices run the same logic across themes: AI tokens, DePIN, DeFi, real-world assets, perpetual DEX tokens, gaming, privacy coins. Reading a category as a single line is the same move as comparing categories before you commit to one, which is how edge differs by category.
One of them will be familiar to this audience. CI-Prediction Markets tracks the prediction market sector itself, with names such as Hyperliquid, Polygon, UMA and SX, weighted by market cap. Whatever you make of any individual token, having the sector as a single series is useful context for anyone whose working life is spent inside these markets. It answers, in one line, whether the market is repricing the category or one name in it.
Third-party benchmarks, with an unusual disclosure
The site also displays the major institutional benchmarks, and here it does something most aggregators do not.
Licensed index data is expensive, and redistribution rights are priced for financial institutions rather than for websites. Most free sites solve this by quietly publishing their own reconstruction and presenting it as the official print. Cryptoindex publishes reconstructions too, and says so on every page where one appears: a market-cap proxy built from public prices, labelled as not the official print.
That distinction has practical consequences. A proxy measures a benchmark; the licensed print is the benchmark, by contractual definition. For following direction and comparing methodologies, the proxy is fine. For anything that resolves against a specific index value, only the administrator's own publication counts.
If a prediction market resolves on an index level, that sentence is the most important one in this review.
Cryptoindex Pro: building your own basket
The second half of the product is a studio at cryptoindex.pro, running on the same engine as the CI indices.
The flow is short. Pick the assets. Set the weights, either equal, by market cap, or your own numbers. Choose a rebalance rule. The tool replays history and shows total return, the worst drawdown and how volatile the ride would have been. Then you compare the result against bitcoin, ether or the CI benchmarks, and publish it with your reasoning attached if you want others to follow it.
Nothing is bought or sold. No wallet and no order. You can build and test a basket before creating an account.
For someone who trades event contracts, the use case is specific. Suppose a market asks whether AI tokens will outperform the broad market this quarter. "AI tokens" is not a defined object until you define it. In the studio you build the basket the way the resolution criteria describe it. Then you backtest how that definition behaved in past quarters, and compare it against a broad index. You end up pricing a claim you have specified rather than one you have imagined. The same applies to any market phrased as "will X category beat Y". The basket is the claim.
Two cautions, which the site states as well. Backtests ignore trading costs, and someone who already knows how the story ended builds them. Crypto also has fewer than three complete cycles of usable history, so risk-adjusted statistics computed on that sample carry more uncertainty than the same numbers in equities. Treat a backtest as a description of how a rule behaves, not as a forecast.
Where it fits beside the Pulse terminal
Two questions sit in front of every crypto event contract, and they need different tools. What kind of market is this, and what does this particular contract cost. Cryptoindex answers the first. A terminal answers the second.
The sequence is short enough to run before a session. Read dominance next to bitcoin's own price, so you know whether a fall is bitcoin-led or risk-off. Check the altseason index for breadth, and remember the 90-day window. Open CI-Alts if the question is about altcoins rather than bitcoin. Then move to the terminal: filter the crypto topic, set the time to close that matches your horizon, and price the contract from the order book. The analytics side of a terminal answers the second question with depth, spread and your own record.
One overlap is worth naming. CI-Prediction Markets holds Polygon and UMA. Polymarket settles on Polygon and resolves through UMA, so that series tracks the rails under every market you trade, not only a theme you might price.
The link between the two is your own reading. You carry the structural picture into the terminal by hand, and the numbers you carry are worth more when you wrote down what you expected before the window opened.
Where the limits are
A review that lists only strengths is a brochure, so here are the constraints worth knowing.
The CI indices are display series. If you want exposure, you buy the assets or a fund elsewhere.
Pricing leans on a primary venue. The series are built from live exchange prices, which gives consistency and depth, and concentrates exposure to one venue's outages and listing decisions.
The cap-weighted series carry no free-float adjustment. Institutional benchmarks adjust for locked and treasury-held supply, which can change weights materially for some assets.
Sector definitions inherit an upstream taxonomy. When a token gets reclassified by the data provider, index composition follows.
Proxy series are approximations. Covered above, and to the site's credit, disclosed on the page rather than in a footer.
None of these are disqualifying for research use. All of them matter if you were planning to treat the numbers as settlement-grade data.
Who it is for
Suppose you trade crypto event contracts, and your process today is reading threads and glancing at a price chart. This is a genuine upgrade to the structural half of that work. Dominance with the stablecoin adjustment, breadth via the altseason index, and the broad-versus-ex-bitcoin spread will answer "what kind of market is this" faster than anything you assemble from a feed.
If you need licensed benchmark values for settlement, go to the administrator. That is true of every free tracker, and this one tells you so.
If you want to test a thesis rather than assert it, the studio is the part to spend time in. Building a basket forces you to define what you mean, which is the discipline that makes a good prediction market trader.
Your next step
Take one crypto market you already follow and run the two halves in order. Open cryptoindex.ai and write down three numbers: dominance, the altseason reading, and etc. Then open the same question in the Pulse terminal, and write down the share price and the spread before you decide anything. Check both a day later. The structural read is worth keeping only if it changed what you would have paid.


